Crypto Support and Resistance: Key Concepts for Trading Success

Updated on Sep 23, 2024
Support and resistance are key when it comes to crypto trading. These concepts help traders identify price levels where an asset may pause, reverse, or break out in the market. By comprehending and applying them correctly, traders can anticipate how the market will move and manage risk more effectively.
In this article, we will examine what support and resistance levels are and how they work.
Let’s get into it.
Understanding Support and Resistance in Cryptocurrency Trading
Definition of Support and Resistance
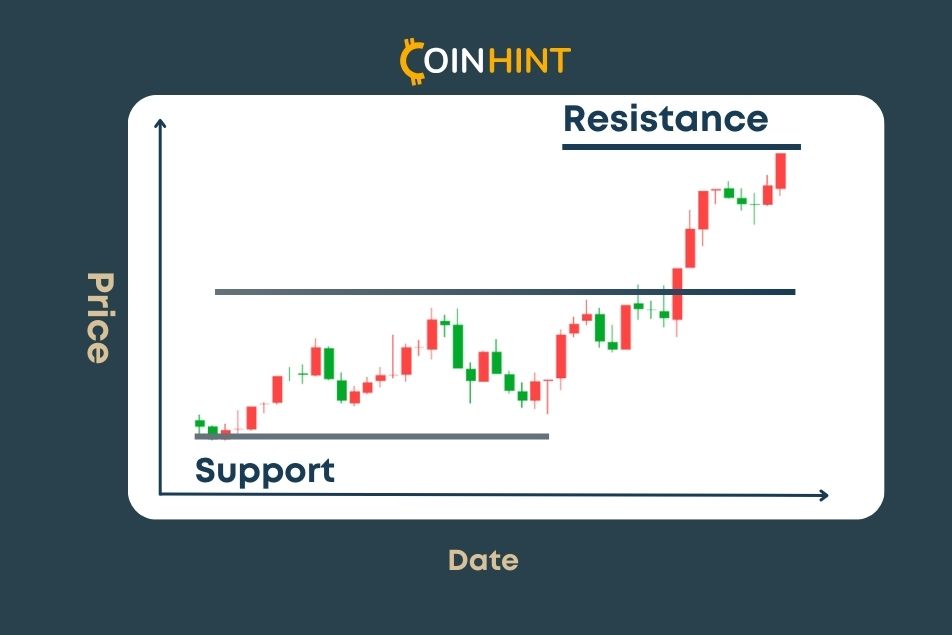
Support and resistance levels for cryptocurrency are common concepts used in technical analysis. These principles show where the crypto price stops and reverses. Hence, traders can identify the key points to enter or exit a trade for high profits by buying low and selling high.
What Is Support in Crypto?
“Support” in crypto refers to the price level at which there is a high buying interest, where the price stops falling and could rise back up.
At this level, buyers believe the price has approached a reasonable level. They then keep buying to defend their position until the cryptocurrency market absorbs their full demand. Once new buyers see that the price has retained its level and is not going down further, they see it as a safe point to enter the market, which prevents the price from falling even further.
What Is Resistance in Crypto?
Resistance is the exact opposite of support. It is the level where the cryptocurrency faces high selling pressure that prevents the price from surging due to an overabundance of sellers.
The bears, for example, will sell their assets for profit if they regard the asset as overvalued. As for new investors, they may notice the lack of demand and enter a short position. Notably, a short position means selling an asset with the hope that it will fall in value, so you buy it and profit from the difference.
The Role of Support and Resistance in Crypto Trading
Why Are Support and Resistance Important?
In crypto, support and resistance levels are critical in trading decision-making as they confirm the direction of a trend. During an uptrend, the support level shows a likely entry point and confirms a bullish trend. On the other hand, resistance shows a possible entry point for a short position to confirm a bearish trend.
These levels also direct the traders on when to exit or enter the market. If the price nears the support level, the trader could consider starting a buy order with the expectation of a price surge. Close to the resistance level, the trader might think of selling with the expectation of a price drop.
In addition, traders get access to insights into the market. Depending on the support and resistance levels and the price movements over time, they can adjust their strategy to stay agile and responsive to the market trends.
How to Identify Support and Resistance Levels
Technical Analysis Tools for Identifying Support and Resistance
Trend Lines
Trend lines are diagonal lines made on a chart to link a series of price points, in an uptrend or downtrend. An upward-sloping trend line can be the support level, showing the price tends to bounce off this line as it surges. On the other hand, a downward-sloping trend line shows resistance where the price is likely to experience high selling pressure.
Fibonacci Retracements
These points are based on the Fibonacci sequence. The common retracement levels used are 23.6%, 38.2%, 50%, 61.8%, and 78.6%. These percentages show how far the price has retraced from the prior trend before possibly continuing in the original direction.
Based on the asset price at the time, the lines can be used as support and resistance indicators.
Pivot Points
These are calculated based on the previous day’s high, low, and closing prices. They allow one to know the potential support and resistance points for the current day. To calculate the main pivot point, you use the average of these three prices (high, low, closing), which becomes the primary level of interest. Above the point, you’ll find resistance levels (R1, R2, R3) and support levels (S1, S2, S3) below it.
The pivot points help the trader anticipate where the asset will have buying or selling pressure.
Peaks and Troughs
Another easy way to plot the support and resistance is using peaks and troughs. Simply, they point towards the highs and lows seen on the price chart. The lower and higher highs will act as the resistance levels, while the lower and higher lows will be the support points.
Preferably, mark the lines on longer timeframes for reliable support and resistance levels.
How to Draw Support and Resistance Levels
The simplest way to draw support and resistance levels is by using a horizontal line through every trough or peak.
These lines are drawn through the low points, which act as support, and high points, which act as resistance, or by focusing on the closing prices, as many traders prioritize them. Extending these lines backward helps determine whether past price movements stalled around similar levels.
When a price level keeps an upward momentum or stabilizes downward trends, it reinforces the significance of that resistance or support. Hence, it is more influential in predicting future price behavior.
Psychological Levels as Support and Resistance
Crypto traders are susceptible to psychological price levels, such as rounded-off numbers like $10,000. When prices approach such numbers, traders anticipate major market reactions, whether it’s buying in anticipation of a surge or selling in anticipation of a plunge.
A psychological level can act as support, preventing the price from going down further if buying interest increases. In this case, the traders could see the rounded number as a bargain, leading to more buy orders, which triggers a stop to the decline.
On the other hand, a psychology level can function as resistance such that when crypto nears the round number, the selling pressure increases, which prevents the price from moving higher.
How Can Support and Resistance Help You Manage Risk?
Stop-loss Order
When buying Bitcoin and other cryptocurrencies, you can place your stop-loss just below a support level such that if the crypto goes below this level, it may keep going down. In turn, the stop-loss will limit your loss.
On the other hand, you can place your stop-loss just above the resistance level. If the price breaks above the resistance, it shows that buyers have control, and you may want to exit the position to prevent more loss.
Risk-reward Ratios
This risk-reward ratio compares a trade’s potential profit to its potential loss to allow you to evaluate if it is worth taking.
It may be more strategic to trade with a well-defined support or resistance level nearby since it offers a more favorable risk-reward ratio.
How to Use Support and Resistance in Trading Strategies?
Bounce Trading
Bounce trading is one of the most common trading strategies for beginners, It involves profiting from a short-term price correction, by “bouncing” off the identified support level. In essence, the trader waits for the crypto price to fall to an important support level, before buying.
Breakout Trading
Breakout trading, on the other hand, is where traders wait for the market to go above the resistance level, which shows a strong upward trend. Traders then buy at this point with the expectation of the price rising even more.
Advanced Concepts in Support and Resistance
Dynamic Support and Resistance
Unlike static levels, dynamic support and resistance shift with the market. Indicators like moving averages continuously adjust, acting as support when the prices approach from below and as resistance when approached from above. The levels give a flexible, real-time look at the price trends, which is, hence, ideal for adaptive trading strategies.
Role Reversal of Support and Resistance
Support and resistance can switch roles after a breakout or breakdown. When a price breaks through resistance, the level can be new support, and broken support may turn into resistance. This flip shows shifting momentum in the market and gives traders a new chance to identify key turning points.
Conclusions
Support and resistance provide clear markers for understanding price behavior and our Coinhint.com analysts encourage using these levels to make an informed and effective decision on when and how to participate in the ever-changing crypto market. These levels will ultimately strengthen your technical analysis skills and give you a strategic edge in crypto trading.
FAQ
-
What Is the Difference Between Support and Resistance?
Support is the price level at which a cryptocurrency stops falling due to higher demand, while resistance is a price level at which it struggles to rise as selling pressure is high. Support acts as a “floor” for price movement, while resistance acts as a “ceiling.”
-
Can Support and Resistance Levels Change?
Yes, support and resistance levels can change, evolving with market conditions. A price level that was once a support may turn into resistance when broken and the other way around. In addition, technical indicators like moving averages bring dynamic support and resistance as they keep updating based on the asset’s price.
-
How Reliable Are Support and Resistance Levels?
Support and resistance levels are used widely and are generally reliable, but no level is guaranteed to hold indefinitely. Their strength depends on the number of times the price is tested, and the time frame used. Longer-term levels on daily or weekly charts are more reliable than shorter time frames. However, note that economic events, news, and other factors, can break the levels unexpectedly.
-
What Happens When Support or Resistance Is Broken?
If support is broken, the price may fall further as selling pressure increases. On the other hand, when resistance is broken, it shows more interest and could cause a rally as the market achieves momentum in the direction of the breakout.
-

-
 What Is Technical Analysis in Crypto Trading?Technical analysis in crypto trading refers to the examination of price charts, chart patterns, and trading activity using historical price data, with the aim of predicting possible future price movements. This article discusses the key concepts of technical analysis, including the use of charts, candlestick patterns, and different types of indicators to determine possible price movements. This trading approach is suitable for both beginners and experts, and it can help them identify market trends and make strategic decisions in the crypto market.
 -
 The Evolution of NFTs: How Non-Fungible Tokens Have Evolved OvertimeThis guide to the history and future of the NFT market explores the stages through which non-fungible tokens (NFTs) have developed, from their creation to the multi-billion market they represent today. It also discusses the milestones and future of NFTs, as well as the development directions in the market today.
 -
 Cryptocurrency vs Traditional Currency: Understanding the Key DifferencesThe growing popularity of cryptocurrency is sparking a global conversation about the future of money and a potential shift away from traditional fiat currency. Understanding the advantages and disadvantages of each helps you equip yourself as an investor to make more informed decisions with your finances.
 -
 Centralized Exchanges vs Decentralized Exchanges: A Complete GuideCryptocurrency exchanges provide trading services for crypto investors. They offer a hub for digital currency holders to swap assets. Apart from the plain exchange of crypto assets, exchanges also offer advanced financial services like derivatives trading and passive income programs.
 -
 Best Strategies for Meme Coins: Tips for Navigating High-Risk InvestmentsTrading meme coins could return significant profits for cryptocurrency investors. However, this depends on the strategy applied. While every asset is prone to fluctuation in value, meme coins are known to be more volatile than most, for this reason, scoring profits in meme coin trading could be harder than with other assets.
 -
 Layer-2 Solutions Explained: A Complete GuideRead this guide to understand layer-2 blockchain solutions. Find out what they are and their role in addressing the scalability issue in the blockchain industry. Get an in-depth overview of the various types of layer-2 solutions and see how they have developed.