7 Best Indicators for Swing Trading Cryptocurrency
Updated on Sep 19, 2024
The basic definition of ‘Swing trading’ in cryptocurrency involves holding open positions for longer periods to capture bigger moves – this can mean holding for more than one day, sometimes up to a few days or weeks. Employing swing indicators in this strategy aims to take advantage of market fluctuations happening over short-to-medium timeframes where there is obvious directional momentum.
Cryptocurrency traders use a variety of tools and swing indicators to make informed decisions when trading. Some of the most popular methods of swing trading utilize technical price indicators. This article will discuss the seven best swing indicators for swing trading cryptocurrency.

What Is Swing Trading in Crypto?
Cryptocurrency swing trading is a trading strategy that focuses on trading short to medium time horizons, ranging from intra-day to several weeks. The goal of swing trading is to take advantage of price swings by capturing a substantial portion of a potential directional move in the market.
The best time to swing trade is during a market trend. This is because a trending market presents more opportunities for trading, and traders can profit from bigger swings in price. A market that is trending is one where prices are constantly trending up or down but never sideways.
Consolidating markets, on the other hand, tend to be more challenging for swing traders. These markets are characterized by indecisiveness, where markets are neither countering nor continuing a trend. As such, prices often consolidate before making large price movements, and it is difficult to know when a consolidation will end, and a trend will begin.
How Does Swing Trading Work?
Crypto swing traders generally prefer to use 1-hour price charts for trade entries and monitor 4-hour to 1-day charts for possible medium term market trends. For best results, they’ll move back into smaller timeframes to execute their trades at the most advantageous prices intraday.
The daily chart is helpful for an overview of a cryptocurrency’s intraday price movement. For example, if a cryptocurrency instrument ends the day higher than its lowest price for the day, a bullish candlestick will reveal that the market was in an uptrend all day.
The market’s noise is filtered out by the larger timeframes, like the daily and weekly charts, which then provide a clear picture of the market’s overall trend. The longer the timeframe, the more accurate the market information will be. This clarity is essential because it indicates to the trader how to execute a trade.
Swing High
We can see the cryptocurrency market going up by looking at swing highs. A swing high occurs when the price reaches a peak and momentarily retraces before continuing its upward trend. A retracement sometimes signals a complete reversal of the trend, breaking successive swing highs. However, when the most recent swing high is higher than earlier ones, this usually indicates an uptrend.
Swing Low
Consecutive lows, followed by temporary rebounds, are called swing lows. If the current low is lower than the previous ones, it indicates a bearish trend. The swing low price is the lowest market price in the time frame swing traders are watching. This period could be a week for some traders or just a few hours for others trading hourly charts.
What Are Swing Trading Indicators?
Crypto swing trading indicators take historical data to figure out various aspects of price action numerically. This can be done using a daily chart or any other chart that is helpful for swing traders when they study the market.
Technical indicators are essential for swing traders to pinpoint the best entry and exit points- even more so than news or fundamental analysis. These indicators help traders determine the direction of the market, whether it is bullish or bearish, and whether there is momentum.
The three main types of swing trading indicators are:
Trend Indicators
Trend indicators can reveal to investors the direction in which the market is moving and if a trend exists. Most often, these indicators highlight the primary trend by lessening short-term price volatility. A commonly used example of a trend indicator is a moving average (MA).
Momentum Indicators
Momentum indicators demonstrate the intensity of a trend and point to whether it might end soon. They also reveal overbought or oversold levels. The relative strength index (RSI) is a commonly used momentum indicator.
Volume Indicators
Volume indicators show how many traders are actively buying and selling an asset at any given time. These indicators provide some useful insight into whether there is strength in the current trend and whether it might be time to buy or sell. Volume information gives traders a unique perspective on market movement from price action, which can help swing traders execute better trades.
Best Crypto Swing Trading Indicators
Below are some of the best indicators for swing trading crypto that swing traders can use to help them make better decisions:
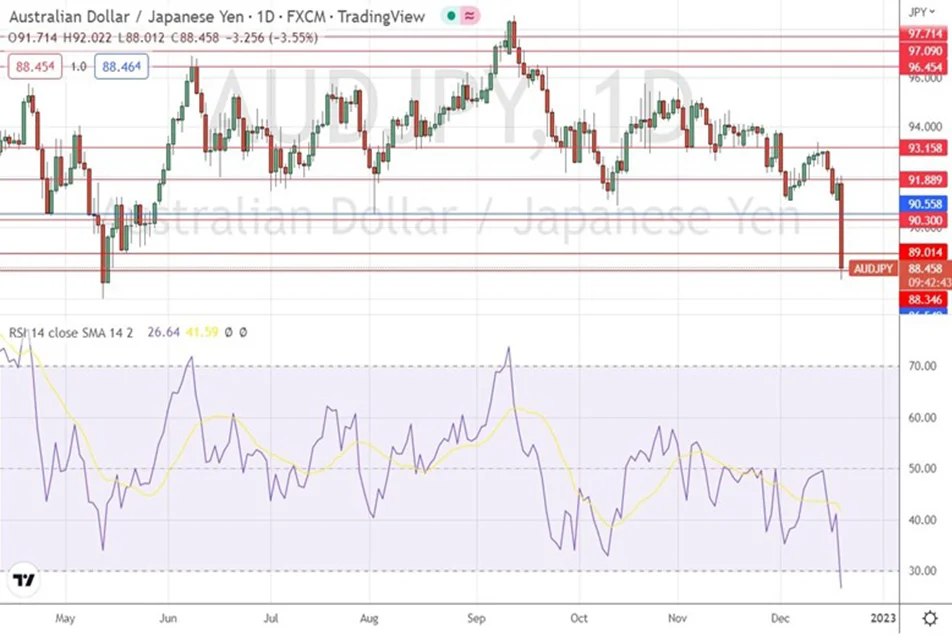
Relative Strength Index (RSI)
This momentum indicator is used to help identify overbought and oversold conditions, giving the trader a higher probability of successful trade entries.
The RSI is an oscillator that helps you understand where a cryptocurrency falls on a spectrum from 0-100. The higher the number, the more overbought the asset is, while a lower number means it’s potentially oversold.
The RSI is an important indicator to monitor as it can help you make timing decisions when getting in or out of an asset. For example, if the RSI climbs above 70, that usually means the crypto is overbought, and a reversal might happen soon. Similarly, if the RSI drops below 30, there’s a good chance that the bearish trend will end, and prices will start going back up again.
Moving Average (MA)
The moving average is a trend indicator that shows an asset’s average price over time, flattening out day-to-day volatility. MAs are categorized as lagging indicators that show past price action, so swing traders use them to confirm a trend instead of predicting future moves.
The look-back periods that a moving average uses to calculate an average may differ. Short-term MAs have a period between 5 days and 50, while medium-term ones have up to 100.
MAs are often used to observe when a short-term MA crosses a longer-term MA. If the former crosses the latter from bottom to top, this typically indicates a bullish market. Meanwhile, if the short-term MA crosses the longer-term MA in a downward direction, that is indicative of a bearish market.
Moving Average Convergence Divergence (MACD)
The Moving Average Convergence Divergence (MACD) is a technical indicator that combines two regular moving averages. MACD calculation generally involves subtraction of the 26-period exponential moving average (EMA) from the 12-period EMA. But these parameters can be customized to better suit your requirements.
This indicator has three elements:
- MACD Line: Calculates the distance between two moving averages.
- Signal Line: Spots changes in price momentum; Considered a trigger for bearish and bullish
- Histogram: Represents the difference between the signal line and the MACD line.
Typically, crypto swing traders buy once the MACD line crosses above the signal line, meaning that momentum is growing. Conversely, they sell when the MACD line crosses below the signal line.
Volume
Often overlooked by beginners, volume is one of the most crucial indicators for swing traders. This indicator normally appears below the main chart by default and provides information about a newly formed trend’s strength.
To put it simply, the volume indicator lets investors know how many people are buying or selling a cryptocurrency at any given time. Generally, the higher the volume, the stronger the trend – if there is one.
This is because more people are putting money into a cryptocurrency, indicating that they believe there’s value in it. However, high volume can also indicate that traders are simply trying to cash out of an asset which will lead to quick price reversals.
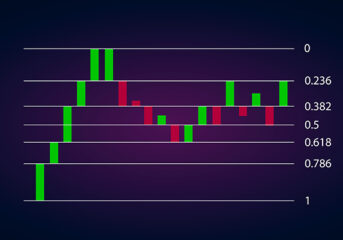
Bollinger Bands
The Bollinger Band is a momentum indicator that has three lines: a moving average and two standard deviations (positive and negative). Many swing traders use this indicator because it is efficient in detecting a trend, overbought and oversold levels, and a measure of volatility.
The width of the Bollinger Band increases in volatile markets and narrows when the market calms down. The closer the bands are to each other, the lower the volatility. Bollinger Bands are effective in trending markets and function well when the price fluctuates between an upper and lower limit.
For instance, when an asset’s price hits the Bollinger Band’s upper line, it may be time for a cryptocurrency swing trader to go short. The lower line of this indicator touching the price typically signals a rebound is on its way, so this is an excellent time to go long.

Stochastic Indicator
The Stochastic indicator is another momentum-based indicator that uses price and relative strength to spot buy and sell signals. It compares the closing price of an asset to the range of its prices over a certain period.
The Stochastic is like the RSI in that it is represented by a chart between zero and 100. However, in this case, the overbought and oversold zones are above 80 and below 20, respectively.
This indicator has two lines: the current value of the Stochastic is displayed on one line, and the other line shows a three-day moving average. Traders use stochastics to find overbought or oversold levels, as well as look for crossovers which often signal directional trend reversals.
Bullish Candlestick Reversal Patterns
Bullish candlestick reversal patterns imply that a market is moving out of a downturn or is trending bullish. Popular candlestick patterns include:
- The Bullish Harami Pattern: Together with other trading indicators, this may suggest a positive trend for an asset’s future price.

- The Three White Soldiers Pattern: This pattern is used to gauge the potential strength of an upcoming bullish trend.

- The Bullish Engulfing Pattern: This is a potent two-candlestick pattern where the market hits a new low but rallies immediately and closes above the opening price of the first candlestick.
How to Start Using Swing Trading Indicators?
To start using swing trading indicators, you will first need to choose which indicators will be most effective for your trading strategy. There are many different options for swing trading, so selecting a few that work well with your particular approach and risk tolerance is important.
Next, you will want to learn how each indicator works and how to use it when making trading decisions. Once you have a basic understanding of each indicator, you should start using these indicators before opening any positions. Typically, you can find good entry points by looking for significant price movements and comparing those with the swing trading indicators you are using. Keeping a trade journal can help keep track of results.
Finally, staying up to date on current market conditions and any changes to your indicators that may affect your strategy is essential. This means monitoring both the technical indicators and macroeconomic fundamentals of an asset to give the best possible chance of making profitable trades.
Final Thoughts
Swing trading can be a highly effective approach for crypto traders looking to take advantage of short-term price movements in the cryptocurrency markets. Using different swing trading indicators can help you identify significant market trends and make well-informed trading decisions that reduce downside risk and increase profits by setting targets.
Coin Hint experts say that it is also essential to remember that to be successful, this strategy requires market knowledge and an understanding of technical analysis. Ultimately, the key to successful swing trading is finding a strategy that works for you and then continually improving your skills through ongoing education, research, and practice. With the right approach, you can enjoy profitable trading while mitigating risk in the cryptocurrency markets.
FAQ
-
How do I choose cryptos for swing trading?
If you’re new to swing trading, the best cryptocurrency coins to start with are Bitcoin and Ethereum, as they have the largest market capitalizations and tend to be the most actively traded and volatile coins on the market.
-
Is swing trading crypto profitable?
Swing trading crypto is profitable for many crypto traders, especially when crypto markets are trending. For many people, swing trading is a nice balance between giving opportunities without having to wait too long. Profitable swing trading depends upon the skill of the trader.
-
Which timeframe is best for swing trading crypto?
Swing traders generally use the four-hour (H4) time frame, but in low or high-volatility markets, some may use daily or even weekly price charts.
-
Is it better to swing trade or day trade crypto?
Compared to day trading, swing trade positions have better potential to blossom over a longer period – and therefore result in more significant gains (or losses). Swing trading is also cheaper in terms of trading fees.
-
 What Is Technical Analysis in Crypto Trading?Technical analysis in crypto trading refers to the examination of price charts, chart patterns, and trading activity using historical price data, with the aim of predicting possible future price movements. This article discusses the key concepts of technical analysis, including the use of charts, candlestick patterns, and different types of indicators to determine possible price movements. This trading approach is suitable for both beginners and experts, and it can help them identify market trends and make strategic decisions in the crypto market.
 -
 Exponential Moving Average (EMA) Explained for Crypto InvestorsOne of the keys to mastering cryptocurrency investing and trading is getting to grips with technical analysis and using technical indicators. The exponential moving average (EMA) is a technical indicator used by crypto investors to navigate the intense volatility of cryptocurrency prices.
 -
 What is Moving Average Convergence Divergence (MACD) Indicator?Moving Averages Convergence Divergence (MACD) is an extremely popular indicator used by traders across a wide range of financial instruments. It has gained the attention of crypto traders over the past few years.
 -
 How Are Fibonacci Retracement Levels Used in Crypto Trading?Leonardo Pisano Bigollo learned the Fibonacci sequence from Indian merchants and introduced it to the Western world in 1202. This was when he designed the 'new' number system with 0. Since then, patterns and ratios in a wide range of micro and macro phenomena are understood with the help of the Fibonacci sequence. Its applications have come a long way, from studying natural phenomena to determining support and resistance levels in financial markets. Read on to learn what the Fibonacci indicator in crypto is. This guide also explains how the Fibonacci indicator can be applied to make more profitable trading decisions in the often-erratic crypto market.
 -
 How to Use Bollinger Bands for Cryptocurrency Trading?Developed in the 1980s by American asset manager and technical analyst John Bollinger, Bollinger Bands® have become an essential analytical tool in the financial markets, especially for equities. At the core, the bands reveal overbought and oversold market conditions. These conditions can provide many opportunities for traders. Now, Bollinger Bands are used extensively by digital currency traders as well. Read on to learn the fundamentals and applications of Bollinger Bands in crypto trading. This guide explains how they can help you time the market better to take advantage of the many opportunities the nascent cryptocurrency market presents.
 -
 Relative Strength Index – What is RSI, and How to Use it for Crypto Trading?Crypto traders use technical indicators like the relative strength index (RSI) indicator to determine whether a crypto asset is ‘overbought’ or ‘oversold’. Because the cryptocurrency market is incredibly volatile, technical indicators provide a way for crypto traders to plot entry and exit points.
 -
 Moving Average – Definition and Why is it Useful for Crypto Trading?The moving average (MA) is a popular technical indicator used by crypto traders to smooth out price action by filtering ‘noise from the market’ (short-term and random price fluctuations). The moving average indicator is a lagging indicator, which means that it is based on past prices. As such, it can only really be seen to confirm a pattern, not predict it. Looking to learn how to use the moving average indicator to trade crypto profitably? Keep reading!